How to view summary
ClickResults on top followed by Summary. Answers are sorted by recency, with the most recent answers at the top.
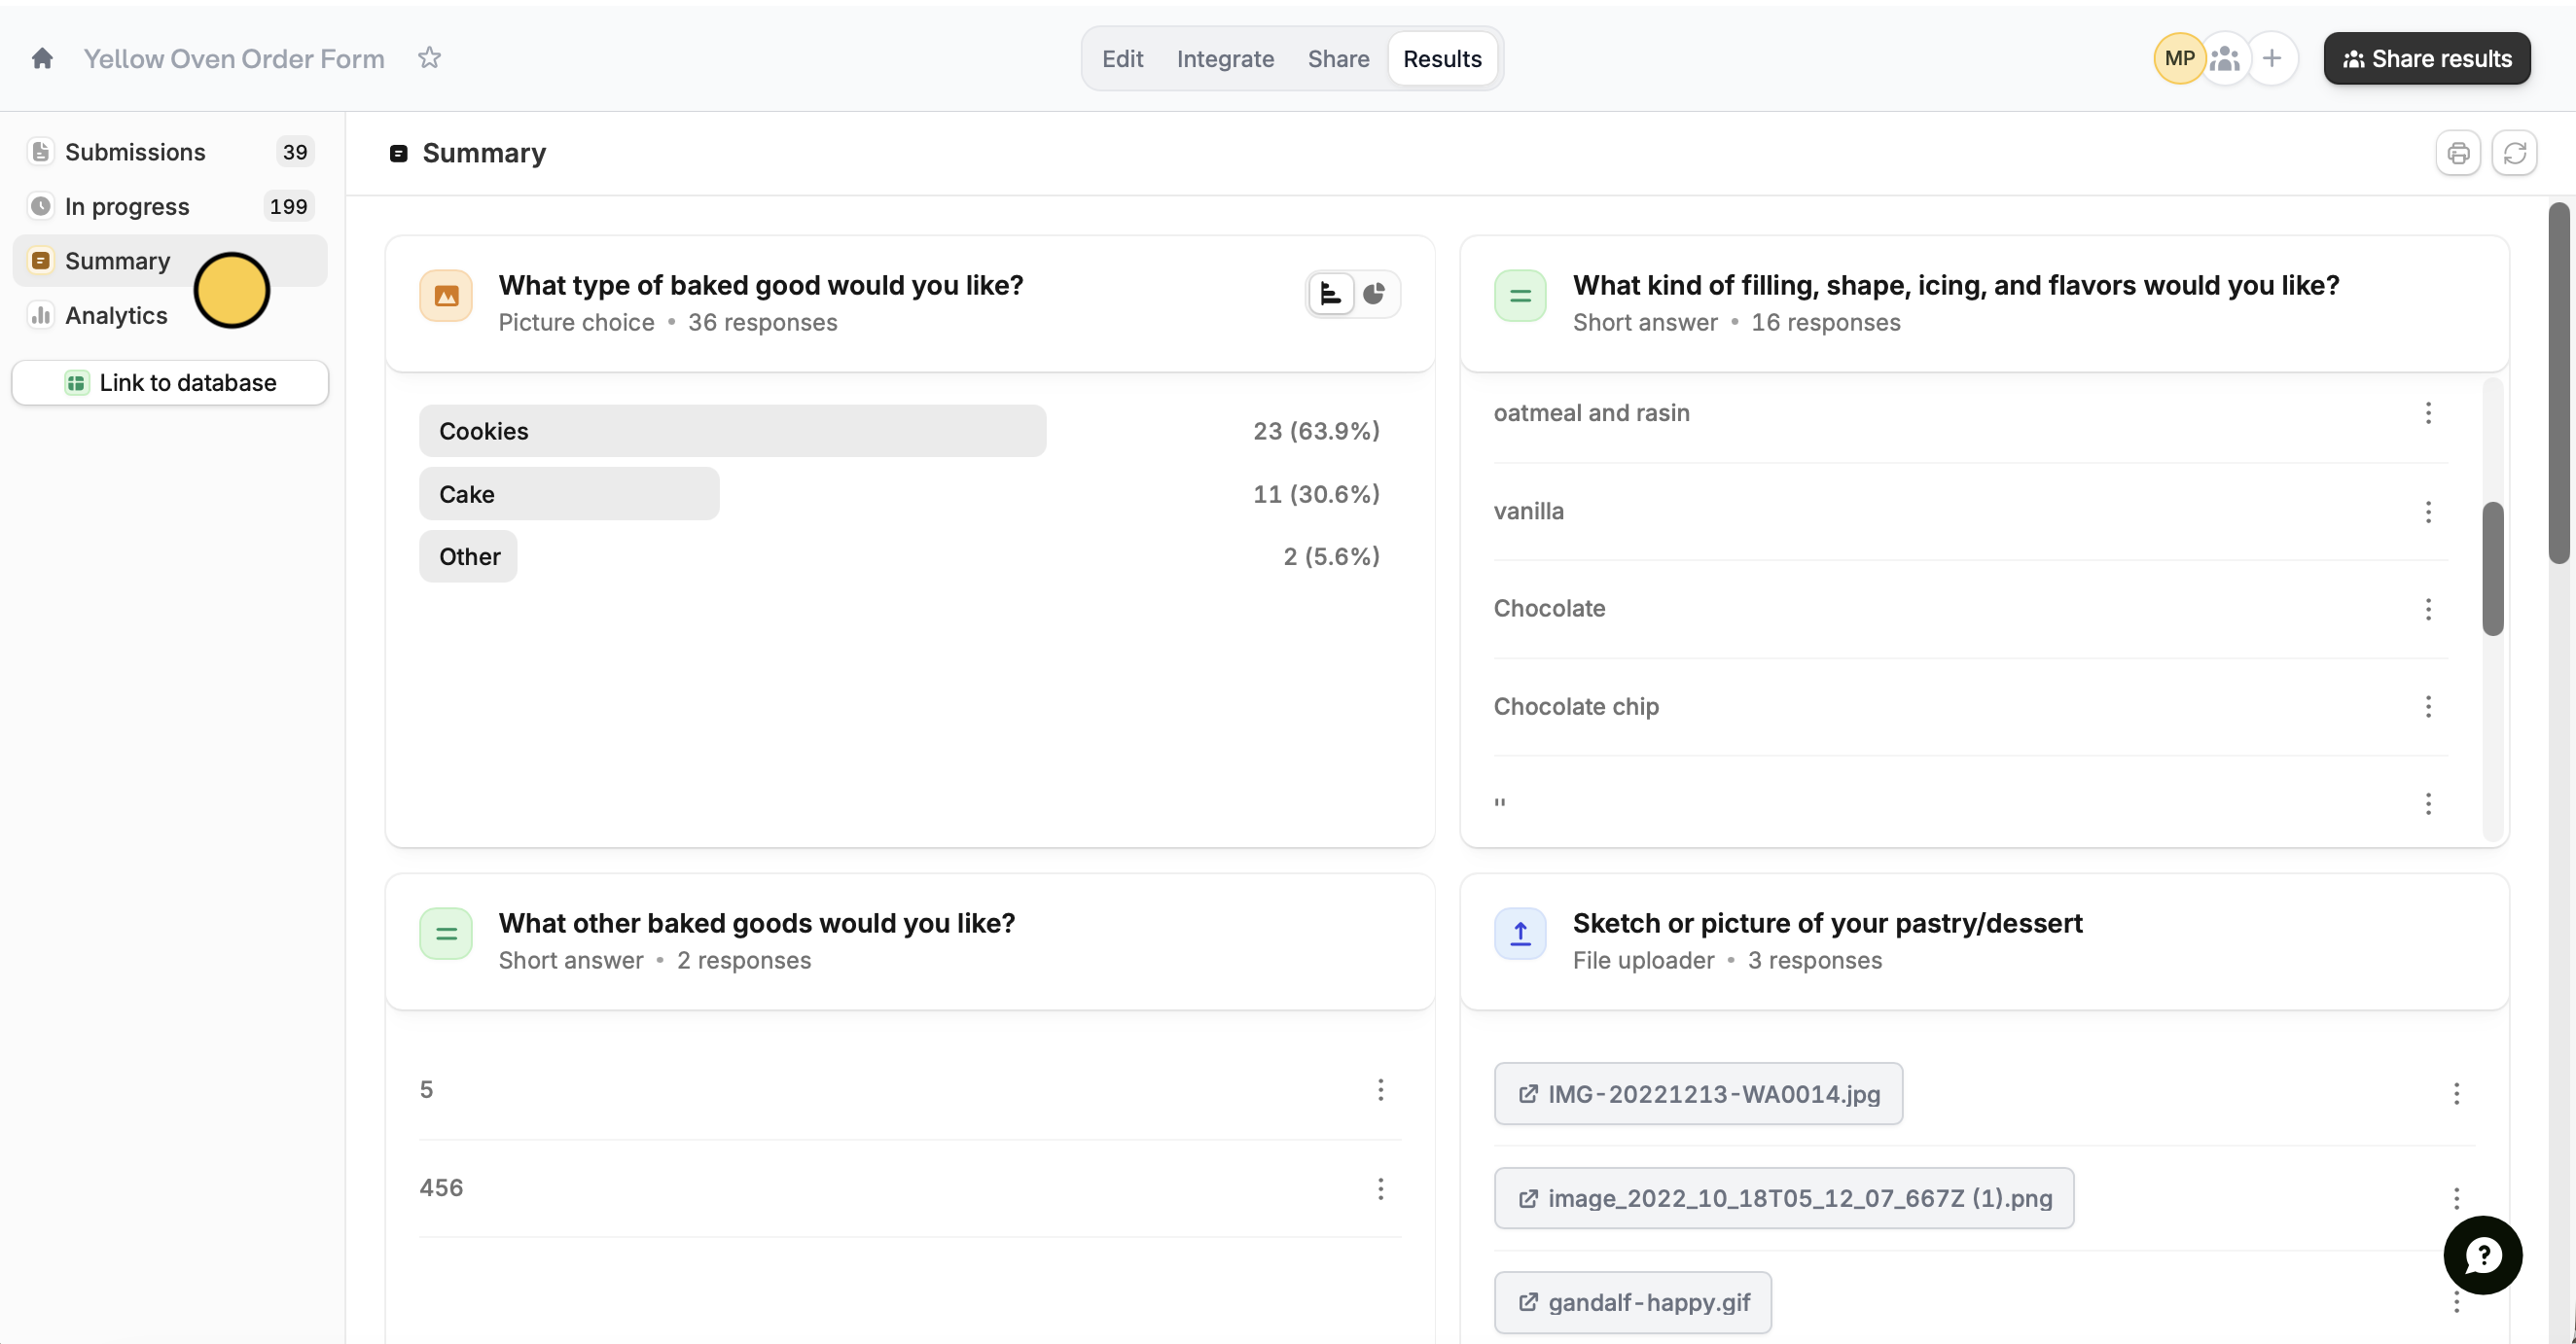
View response.

Visualize your data
Fillout helps you spot trends across your survey results. Choice questions are summarized with a bar chart. Change the view by clicking .
Print and download summary
Simply click theprint icon on the top right to get a hard copy of the summary. In the popup screen, you’ll also be able to download this by clicking Save as PDF or Download depending on your device.
Related articles
Partial submissions
Auto-save progress so respondents can resume later.
View Responses
View all submissions to your form. Filter, sort, or export to CSV.
Delete submissions
Remove duplicates, and other unnecessary entries.